PLANNING
Control over your planning, without spreadsheets
A visual timeline per project and a capacity overview across all your projects let you see at a glance what is running, what is slipping and where you still have room.
GANTT TIMELINE
A visual timeline per project and across everything
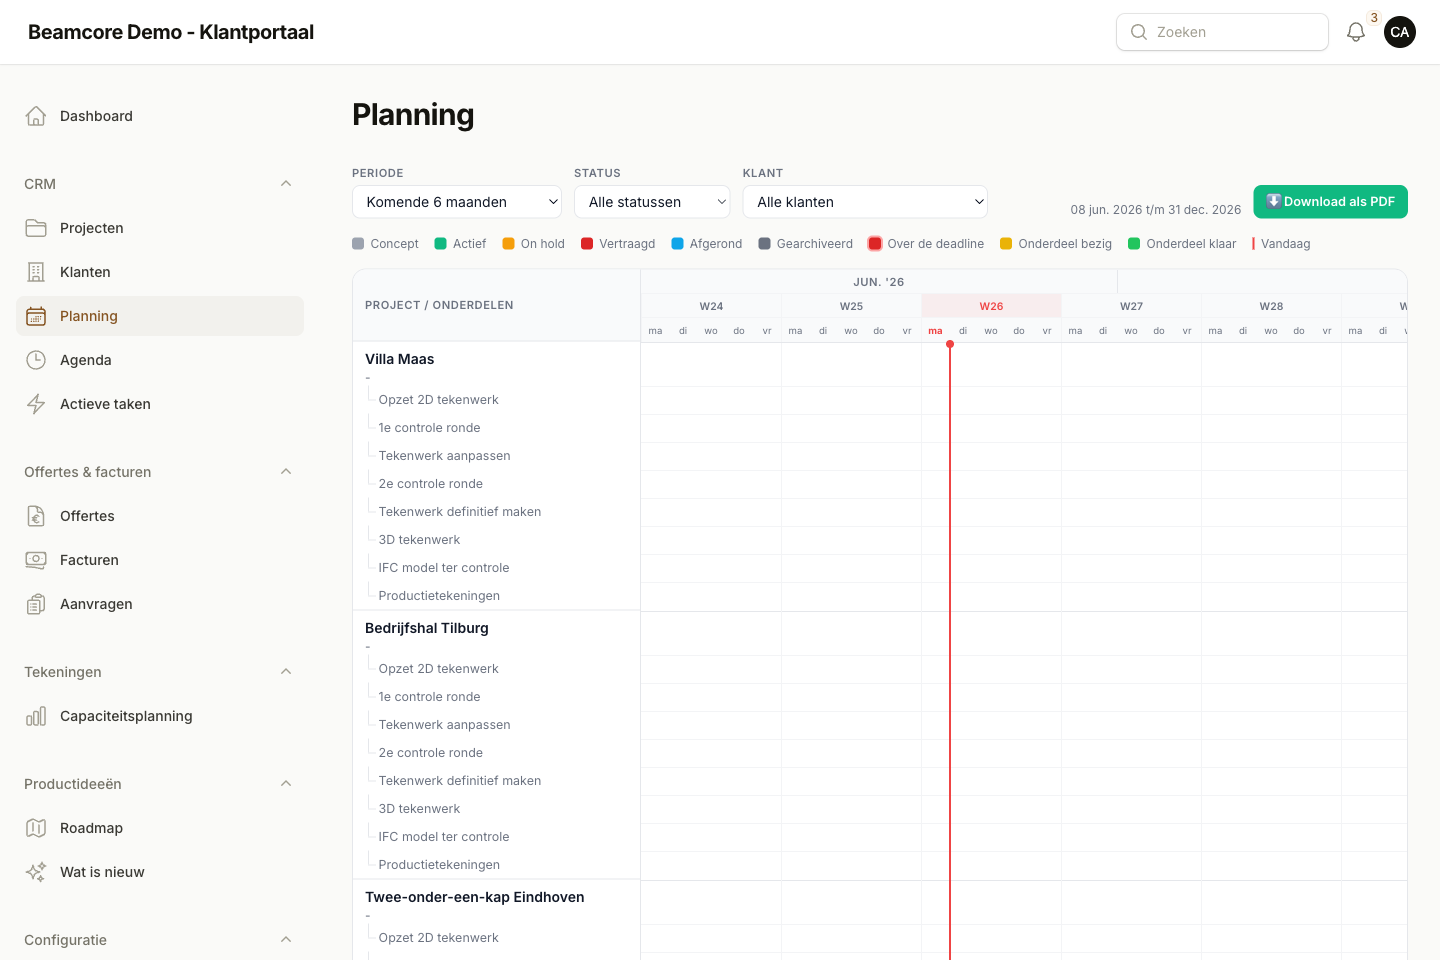
The planning timeline shows each project as a series of bars in a Gantt view, both per project and across all your projects. A clear colour legend makes the status readable at a glance.
- Statuses with their own colour: concept, active, on hold, delayed, completed and past the deadline.
- Bars can be dragged and adjusted in length, so you steer the planning straight away.
- A "today" line shows where you stand relative to the planning.
- Filter by period, status or client to quickly find what you are looking for.
CAPACITY PLANNING
See your workload broken down over time
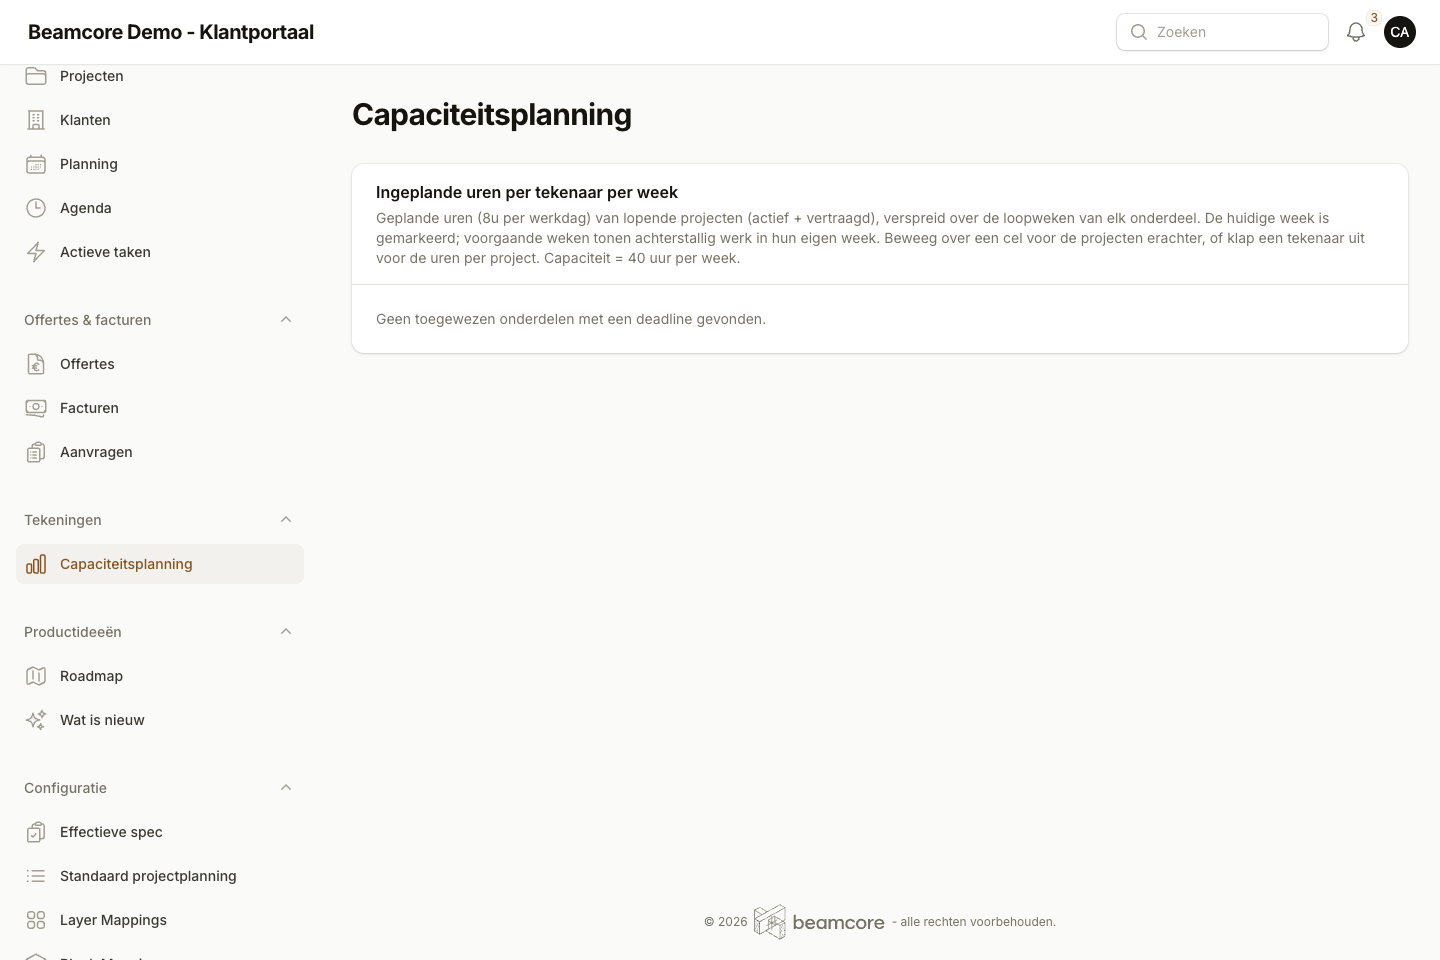
Capacity planning lays the workload across all your projects side by side over time. That way you can see ahead where it gets busy and where you still have room to schedule work.
- The workload is broken down over time, so peaks and troughs are immediately visible.
- Hover over a bar for details per project and per task.
- Schedule new work for the moments where you actually have capacity.
- Prevent projects from quietly stacking up on top of each other.
HOW IT WORKS
From template to delivered planning
-
01
Start with a template
Create your project planning from a standard template, so every project starts the same way and without hassle.
-
02
Adjust the bars
Drag bars to the right date and adjust them in length until the planning matches reality.
-
03
Log your hours
Record the hours worked per project under "Logged hours" and keep a grip on progress.
-
04
Share the planning
Download the planning as a PDF and share it easily with your team, client or subcontractors.
Ready for planning without spreadsheets?
Discover in a demo how projects and capacity come together in one environment.